Was this page helpful?
Caution
You're viewing documentation for a previous version. Switch to the latest stable version.
Troubleshooting guide for ScyllaDB Manager and ScyllaDB Monitoring integration
Symptom
ScyllaDB Manager and ScyllaDB Monitoring are installed, but when you look at ScyllaDB Monitoring, the ScyllaDB Manager dashboard shows the status of ScyllaDB Manager as not connected.
The following procedure contains several tests to pinpoint the integration issue.
Solution
Verify that ScyllaDB Manager Server is up and running. From the ScyllaDB Monitoring node, run the following ScyllaDB Manager commands:
sctool version
sctool status -c <CLUSTERNAME>
If you get a response with no errors, ScyllaDB Manager is running.
Verify that ScyllaDB Monitoring is running with the Manager Dashboard (Monitoring server) by running the command for monitoring, including the
-Mflag, which specifies the Manager Dashboard version. For example, 2.0.
/start-all.sh -s path/to/scylla_servers.yml -n path/to/node_exporter_servers.yml -d path/to/mydata -v 3.0 -M 2.0
From ScyllaDB Monitoring, check the ScyllaDB Manager Dashboard and confirm if the ScyllaDB Manager dashboard shows ScyllaDB Manager as connected. If yes, you do not need to continue. If no, continue to the next step.
The issue might be a case where the IP addresses are not synchronized. This happens when ScyllaDB Manager binds the Prometheus API to one IP address and the Prometheus pulls Manager metrics from a different IP address.
Note
When Monitoring and Manager are running on the same server, this IP might be different than 127.0.0.1 (localhost).
In
/etc/scylla-manager/scylla-manager.yaml, change the TCP address that Prometheus is bound to theIPADDRESS:PORTof where Prometheus is running:
# Bind prometheus API to the specified TCP address using HTTP protocol.
# By default it binds to all network interfaces but you can restrict it
# by specifying it like this 127:0.0.1:5090 or any other combination
# of ip and port.
prometheus: '172.17.0.1:5090'
In
scylla-monitoring/prometheus/scylla_manager_servers.yml, change the IP address Prometheus uses to pull ScyllaDB Manager metrics from. The IP address is set to172.17.0.1:5090by default.
- targets:
  - 172.17.0.1:5090
5. If you are not using the ScyllaDB Monitoring stack (Docker), and are using your own Prometheus stack, check that the ScyllaDB Manager target is listed.
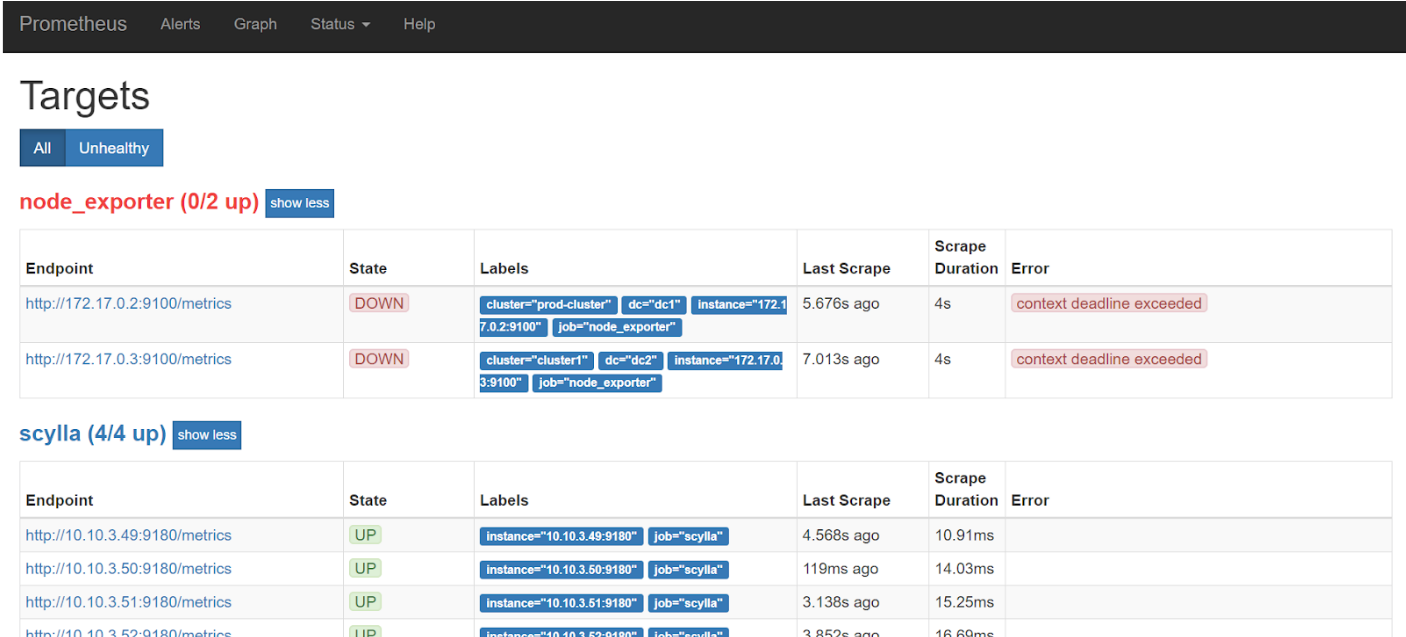
Navigate to: http://[Prometheus_IP]:9090/targets (status menu -> targets). It may be that only ScyllaDB and Node_Exporter sections are there, and ScyllaDB Manager is missing:

If this is the case, you need to add scylla_manager to Prometheus by adding scylla_manager target, as detailed above. Once you do, you should see scylla_manager:

