Was this page helpful?
Caution
You're viewing documentation for a previous version. Switch to the latest stable version.
Integrate Scylla with DataDog
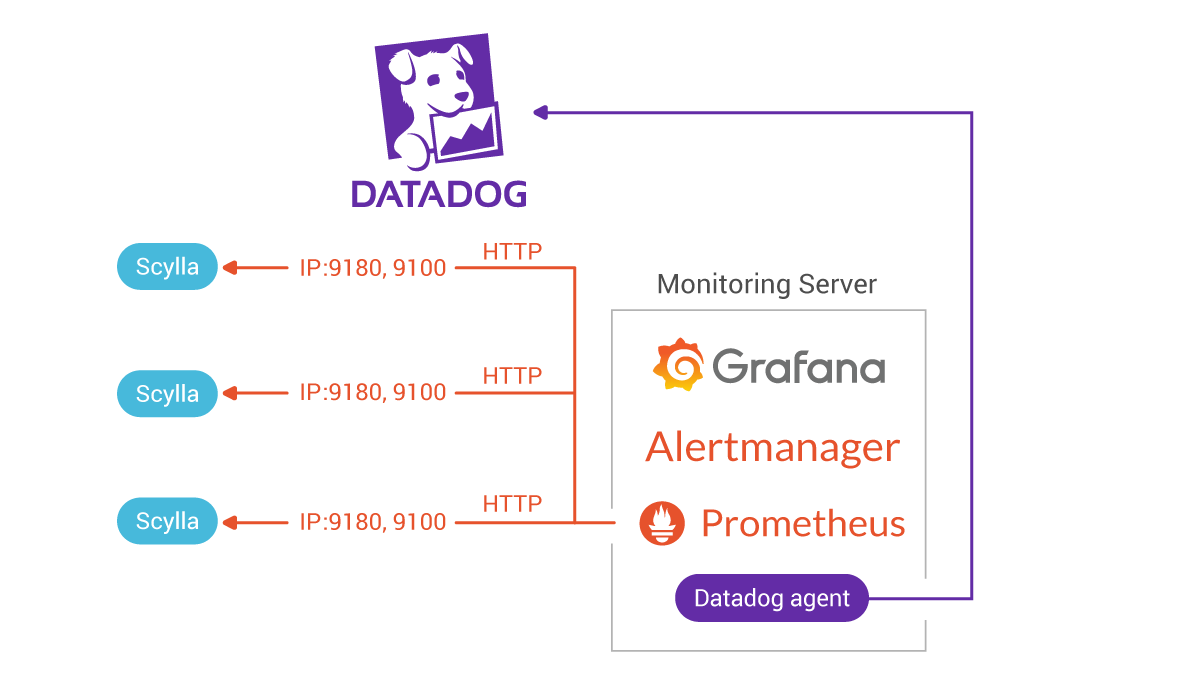
Datadog is a popular SaaS monitoring service. The default ScyllaDB Monitoring Stack for Scylla is based on Prometheus and Grafana. You can export metrics from this stack and into DataDog, using it to monitor Scylla.
The way to do so is running a DataDog Agent to pull metrics from Prometheus and push it to DataDog as follows:

If you are a Scylla Cloud user, you can export your cluster metrics to your own Prometheus and use the same method to export the metrics from Prometheus to DataDog, effectively monitoring your Scylla Cloud cluster with DataDog.
The list below contains integration projects using DataDog to monitor Scylla. If you have monitored Scylla with DataDog and want to publish the results, contact us using the mailing list.
