ScyllaDB University LIVE, FREE Virtual Training Event | March 21
Register for Free
ScyllaDB Documentation Logo Documentation
  • Server
  • Cloud
  • Tools
    • ScyllaDB Manager
    • ScyllaDB Monitoring Stack
    • ScyllaDB Operator
  • Drivers
    • CQL Drivers
    • DynamoDB Drivers
  • Resources
    • ScyllaDB University
    • Community Forum
    • Tutorials
Download
ScyllaDB Docs ScyllaDB Open Source Knowledge Base Using the perf utility with ScyllaDB

Caution

You're viewing documentation for a previous version. Switch to the latest stable version.

Using the perf utility with ScyllaDB

This article contains useful tips & tricks for using the perf utility with ScyllaDB. The perf utility is particularly useful when debugging a pegged shard.

Due to its thread-per-core nature, looking at aggregates is rarely useful as it tends to hide bad behavior that is localized to specific CPUs. Looking at an individual CPU will make those anomalies easier to see. Once you notice that a ScyllaDB shard requires investigation (for example, when the ScyllaDB Monitor shard view shows that a particular shard is more loaded than others), you can use the seastar-cpu-map.sh script described here to determine which Linux CPU hosts that ScyllaDB shard. For example: .. code-block:: bash

seastar-cpu-map.sh -n scylla -s 0

Output:

shard: 0, cpu: 1

In the above example, shard 0 is investigated using the -s argument and providing the shard number. The results show that shard 0 runs on Linux CPU 1. In all perf commands that follow, you can add the -C 1 argument to restrict perf to look only at CPU 1.

When is perf useful?

Perf` is most useful when the CPU being probed runs at 100% utilization so that you can identify large chunks of execution time used by particular functions.

Note that due to polling, ScyllaDB will easily drive CPUs to 100% even when it is not bottlenecked. It will spin (poll) for some time, waiting for new requests. It tends to show in the perf reports as functions related to polling having high CPU time.

Perf can also be a useful tool when you suspect that something that shouldn’t be running is running. One example is systems with very high reactor_utilization (indicating non-polling work), where the Linux view of system CPU utilization is also high. It indicates that the Linux Kernel, not ScyllaDB, is the main user of the CPU, so additional investigation is needed.
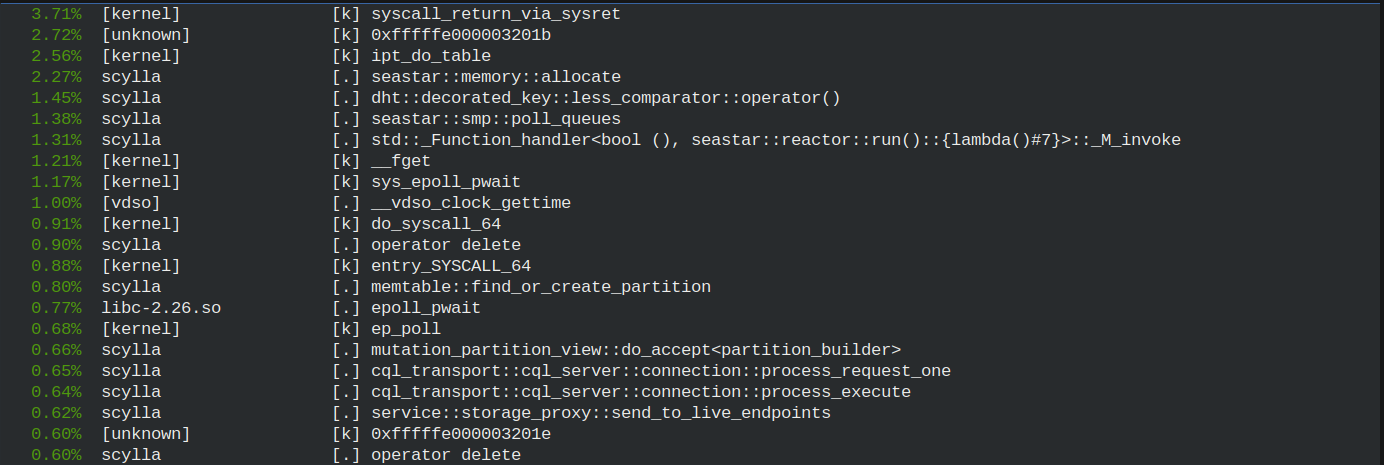
perf top

Perf top shows a point-in-time view of the system. The figure below shows the result of running perf top -C 1.

../_images/perf-top.png

Callgraphs

Perf can generate callgraphs. They are useful when you want to understand the complete call chain that results in a function being called. You can add --call-graph=dwarf  -F 99 to any recording command, such as perf top or perf record, to generate a callgraph.

For example, to record the callgraphs in CPU2:

sudo perf record -C 2 --call-graph=dwarf  -F 99

You can dump the results to the trace.txt file by running:

sudo perf report  --no-children --stdio > /tmp/trace.txt

Was this page helpful?

PREVIOUS
Update a Primary Key
NEXT
Configure ScyllaDB Networking with Multiple NIC/IP Combinations
  • Create an issue
  • Edit this page

On this page

  • Using the perf utility with ScyllaDB
    • When is perf useful?
    • perf top
    • Callgraphs
ScyllaDB Open Source
  • 6.2
    • master
    • 6.2
    • 6.1
    • 6.0
    • 5.4
    • 5.2
    • 5.1
  • Getting Started
    • Install ScyllaDB
      • Launch ScyllaDB on AWS
      • Launch ScyllaDB on GCP
      • Launch ScyllaDB on Azure
      • ScyllaDB Web Installer for Linux
      • Install ScyllaDB Linux Packages
      • Install scylla-jmx Package
      • Run ScyllaDB in Docker
      • Install ScyllaDB Without root Privileges
      • Air-gapped Server Installation
      • ScyllaDB Housekeeping and how to disable it
      • ScyllaDB Developer Mode
    • Configure ScyllaDB
    • ScyllaDB Configuration Reference
    • ScyllaDB Requirements
      • System Requirements
      • OS Support by Linux Distributions and Version
      • Cloud Instance Recommendations
      • ScyllaDB in a Shared Environment
    • Migrate to ScyllaDB
      • Migration Process from Cassandra to ScyllaDB
      • ScyllaDB and Apache Cassandra Compatibility
      • Migration Tools Overview
    • Integration Solutions
      • Integrate ScyllaDB with Spark
      • Integrate ScyllaDB with KairosDB
      • Integrate ScyllaDB with Presto
      • Integrate ScyllaDB with Elasticsearch
      • Integrate ScyllaDB with Kubernetes
      • Integrate ScyllaDB with the JanusGraph Graph Data System
      • Integrate ScyllaDB with DataDog
      • Integrate ScyllaDB with Kafka
      • Integrate ScyllaDB with IOTA Chronicle
      • Integrate ScyllaDB with Spring
      • Shard-Aware Kafka Connector for ScyllaDB
      • Install ScyllaDB with Ansible
      • Integrate ScyllaDB with Databricks
      • Integrate ScyllaDB with Jaeger Server
      • Integrate ScyllaDB with MindsDB
    • Tutorials
  • ScyllaDB for Administrators
    • Administration Guide
    • Procedures
      • Cluster Management
      • Backup & Restore
      • Change Configuration
      • Maintenance
      • Best Practices
      • Benchmarking ScyllaDB
      • Migrate from Cassandra to ScyllaDB
      • Disable Housekeeping
    • Security
      • ScyllaDB Security Checklist
      • Enable Authentication
      • Enable and Disable Authentication Without Downtime
      • Creating a Custom Superuser
      • Generate a cqlshrc File
      • Reset Authenticator Password
      • Enable Authorization
      • Grant Authorization CQL Reference
      • Certificate-based Authentication
      • Role Based Access Control (RBAC)
      • Encryption: Data in Transit Client to Node
      • Encryption: Data in Transit Node to Node
      • Generating a self-signed Certificate Chain Using openssl
      • Configure SaslauthdAuthenticator
    • Admin Tools
      • Nodetool Reference
      • CQLSh
      • Admin REST API
      • Tracing
      • ScyllaDB SStable
      • ScyllaDB Types
      • SSTableLoader
      • cassandra-stress
      • SSTabledump
      • SSTableMetadata
      • ScyllaDB Logs
      • Seastar Perftune
      • Virtual Tables
      • Reading mutation fragments
      • Maintenance socket
      • Maintenance mode
      • Task manager
    • ScyllaDB Monitoring Stack
    • ScyllaDB Operator
    • ScyllaDB Manager
    • Upgrade Procedures
      • ScyllaDB Versioning
      • ScyllaDB Open Source Upgrade
      • ScyllaDB Open Source to ScyllaDB Enterprise Upgrade
      • ScyllaDB Image
      • ScyllaDB Enterprise
    • System Configuration
      • System Configuration Guide
      • scylla.yaml
      • ScyllaDB Snitches
    • Benchmarking ScyllaDB
    • ScyllaDB Diagnostic Tools
  • ScyllaDB for Developers
    • Develop with ScyllaDB
    • Tutorials and Example Projects
    • Learn to Use ScyllaDB
    • ScyllaDB Alternator
    • ScyllaDB Drivers
      • ScyllaDB CQL Drivers
      • ScyllaDB DynamoDB Drivers
  • CQL Reference
    • CQLSh: the CQL shell
    • Appendices
    • Compaction
    • Consistency Levels
    • Consistency Level Calculator
    • Data Definition
    • Data Manipulation
      • SELECT
      • INSERT
      • UPDATE
      • DELETE
      • BATCH
    • Data Types
    • Definitions
    • Global Secondary Indexes
    • Expiring Data with Time to Live (TTL)
    • Functions
    • Wasm support for user-defined functions
    • JSON Support
    • Materialized Views
    • Non-Reserved CQL Keywords
    • Reserved CQL Keywords
    • Service Levels
    • ScyllaDB CQL Extensions
  • Alternator: DynamoDB API in Scylla
    • Getting Started With ScyllaDB Alternator
    • ScyllaDB Alternator for DynamoDB users
  • Features
    • Lightweight Transactions
    • Global Secondary Indexes
    • Local Secondary Indexes
    • Materialized Views
    • Counters
    • Change Data Capture
      • CDC Overview
      • The CDC Log Table
      • Basic operations in CDC
      • CDC Streams
      • CDC Stream Generations
      • Querying CDC Streams
      • Advanced column types
      • Preimages and postimages
      • Data Consistency in CDC
    • Workload Attributes
  • ScyllaDB Architecture
    • Data Distribution with Tablets
    • ScyllaDB Ring Architecture
    • ScyllaDB Fault Tolerance
    • Consistency Level Console Demo
    • ScyllaDB Anti-Entropy
      • ScyllaDB Hinted Handoff
      • ScyllaDB Read Repair
      • ScyllaDB Repair
    • SSTable
      • ScyllaDB SSTable - 2.x
      • ScyllaDB SSTable - 3.x
    • Compaction Strategies
    • Raft Consensus Algorithm in ScyllaDB
    • Zero-token Nodes
  • Troubleshooting ScyllaDB
    • Errors and Support
      • Report a ScyllaDB problem
      • Error Messages
      • Change Log Level
    • ScyllaDB Startup
      • Ownership Problems
      • ScyllaDB will not Start
      • ScyllaDB Python Script broken
    • Upgrade
      • Inaccessible configuration files after ScyllaDB upgrade
    • Cluster and Node
      • Handling Node Failures
      • Failure to Add, Remove, or Replace a Node
      • Failed Decommission Problem
      • Cluster Timeouts
      • Node Joined With No Data
      • NullPointerException
      • Failed Schema Sync
    • Data Modeling
      • ScyllaDB Large Partitions Table
      • ScyllaDB Large Rows and Cells Table
      • Large Partitions Hunting
      • Failure to Update the Schema
    • Data Storage and SSTables
      • Space Utilization Increasing
      • Disk Space is not Reclaimed
      • SSTable Corruption Problem
      • Pointless Compactions
      • Limiting Compaction
    • CQL
      • Time Range Query Fails
      • COPY FROM Fails
      • CQL Connection Table
    • ScyllaDB Monitor and Manager
      • Manager and Monitoring integration
      • Manager lists healthy nodes as down
    • Installation and Removal
      • Removing ScyllaDB on Ubuntu breaks system packages
  • Knowledge Base
    • Upgrading from experimental CDC
    • Compaction
    • Consistency in ScyllaDB
    • Counting all rows in a table is slow
    • CQL Query Does Not Display Entire Result Set
    • When CQLSh query returns partial results with followed by “More”
    • Run ScyllaDB and supporting services as a custom user:group
    • Customizing CPUSET
    • Decoding Stack Traces
    • Snapshots and Disk Utilization
    • DPDK mode
    • Debug your database with Flame Graphs
    • How to Change gc_grace_seconds for a Table
    • Gossip in ScyllaDB
    • Increase Permission Cache to Avoid Non-paged Queries
    • How does ScyllaDB LWT Differ from Apache Cassandra ?
    • Map CPUs to ScyllaDB Shards
    • ScyllaDB Memory Usage
    • NTP Configuration for ScyllaDB
    • Updating the Mode in perftune.yaml After a ScyllaDB Upgrade
    • POSIX networking for ScyllaDB
    • ScyllaDB consistency quiz for administrators
    • Recreate RAID devices
    • How to Safely Increase the Replication Factor
    • ScyllaDB and Spark integration
    • Increase ScyllaDB resource limits over systemd
    • ScyllaDB Seed Nodes
    • How to Set up a Swap Space
    • ScyllaDB Snapshots
    • ScyllaDB payload sent duplicated static columns
    • Stopping a local repair
    • System Limits
    • How to flush old tombstones from a table
    • Time to Live (TTL) and Compaction
    • ScyllaDB Nodes are Unresponsive
    • Update a Primary Key
    • Using the perf utility with ScyllaDB
    • Configure ScyllaDB Networking with Multiple NIC/IP Combinations
  • Reference
    • AWS Images
    • Azure Images
    • GCP Images
    • Configuration Parameters
    • Glossary
    • Limits
    • API Reference (BETA)
    • Metrics (BETA)
  • ScyllaDB FAQ
  • Contribute to ScyllaDB
Docs Tutorials University Contact Us About Us
© 2025, ScyllaDB. All rights reserved. | Terms of Service | Privacy Policy | ScyllaDB, and ScyllaDB Cloud, are registered trademarks of ScyllaDB, Inc.
Last updated on 08 May 2025.
Powered by Sphinx 7.4.7 & ScyllaDB Theme 1.8.6